
Information for Peptide: SGAQASSTPLSPTR from LMNA_HUMAN
1. Biological Peptide
1.1 Native Sequence
R.SGAQASSTPLSPTR.I
1.2 Peptide Properties
| Start | Stop | MW | m/z for 2+ | m/z for 3+ | pI |
|---|---|---|---|---|---|
| 12 | 25 | 1358.68 | 680.35 | 453.9 | 9.47 |
1.3 Fragment Ion Table
| AA | b Ion Series | b Ion Mass | y Ion Series | y Ion Mass |
|---|---|---|---|---|
| S | b | y | ||
| G | b | y | ||
| A | b | y | ||
| Q | b | y | ||
| A | b | y | ||
| S | b | y | ||
| S | b | y | ||
| T | b | y | ||
| P | b | y | ||
| L | b | y | ||
| S | b | y | ||
| P | b | y | ||
| T | b | y | ||
| R | b | y |
2. Synthetic Peptide
2.1 Synthetic (Internal Standard) Peptide Sequence
(NONE)
2.2 Peptide Properties
(NONE)
2.3 Fragment Ion Table
(NONE)
2.4 Peptide Synthesis Report
(NONE)
2.5 QqQ MS/MS
2.6 Calibration Curve of Standard
Description: NONE
Experiment Description: Cells from HCT116 were lysed in 8M urea/ 100mM ammonium bicarbonate buffer on ice. The equivalent of 100,000 cells were loaded onto a SDS gel. The protein of interest was excised and ingel digestion with trypsin was performed after reduction and alkylation with TCEP and IAA. 1/4 of the resulting digest was then analyzed on a Thermo Scientific TSQ mass spectrometer.
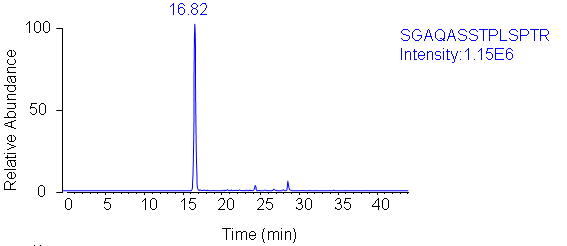
2.7 LC-MRM Analysis of Biological and Standard Peptides Illustrates Elution Times
2.8 Pseudo MS/MS Comparison of Transition Patterns for Biological/Standard Peptides
